Archive
Parallel Timelines Follow A Race
Canada’s National Post Summarizes America’s Republican presidential race.
Running timelines in parallel presents the dynamics of the Republican “horse race” at a glance. Looking closer, each time line is annotated with the candidate’s share of voters. Everything you need to know in one full-page infographic. (Click on it to see more detail.)
Your Life as an Infographic
Vizualize.me Instantly Turns Your LinkedIn Resume Into an Infographic
Raises the interesting point that potential employers have a tedious task plowing through stacks of resumes. “In the age of data overload, the text resume is slowly becoming a living anachronism,” says the company’s press release. “The average resume is now over 2 pages long with more than 1000 words.” The question is: can this situation be alleviated via an Infographic?
The problem with these computer-generated infographics is that they are largely chart junk: graphics for the sake of graphics that do little to clarify and communicate. However, as a first attempt to strike out in a new direction we should not be too critical of the details. The time line presentation of education and past experience does communicate well. Other parts of the infographic need work.
A New Way to Display Timelines on the Web
ProPublica releases free tool for creating dynamic timelines
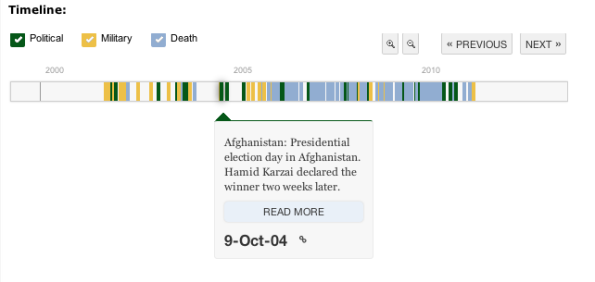
Timelines are a great tool for visual explanation, but also time consuming to create. ProPublica speeds the job with its TimelineSetter tool for creating beautiful interactive HTML timelines from information entered into a simple spreadsheet. The program automatically creates a package of HTML and JavaScript code that can be dropped into a web page. TimelineSetter displays the events as a series of color bars on the scrollable timeline, which when clicked present additional information.
Although a powerful time saver, ProPublica wasted no time on providing a friendly user interface. TimelineSetter is a javascript that runs form the computer’s command line. This may be too geeky for most journalists so a bit more effort from ProPublica would probably go a long way to popularize their otherwise very useful tool.


